There are a bunch of aspects to running an e-commerce business but when you boil it down, everything comes back to how your website, brand, and products are perceived by consumers. You can have your own assumptions of what will work but how do you really know what’s going to drive a shopper to convert into a sale?
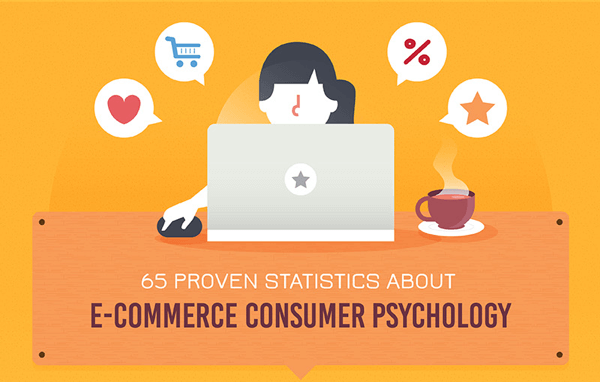
Our friends over at Bargain Fox have helped us all out with an in-depth look at e-commerce consumer psychology. Are you ready for 65 stats that will help you transform your e-commerce business, website design, e-commerce promotional strategy, and overall sales numbers? Check out this epic e-commerce infographic below!
Our favorite e-commerce statistics
- 93% of consumers consider visual appearance to be the key deciding factor in a purchasing decision. Click to Tweet
- Customer purchases increase by 45% when forced registration is removed from the checkout page. Click to Tweet
- 56% of consumers abandon carts when presented with unexpected costs. Click to Tweet
- 68% of US online shoppers engage with LiveChat. Click to Tweet
- Engaged customers are 7 times more like to respond to brands promotional offers. Click to Tweet
- 68% of consumers strongly believe that coupons have a positive impact on a retailer’s brand. Click to Tweet
- Orders with free shipping average around 30% higher order value. Click to Tweet
- 93% of online shoppers like to shop at small and local retailers. Click to Tweet
- 40% of shoppers prefer receiving discounts over loyalty program points. Click to Tweet
- Adding testimonials to a website increases conversion by 34%. Click to Tweet

Sourced by: BargainFox